Navigating Home Prices: A Guide to Median vs. Average Values
Navigating Home Prices: A Guide to Median vs. Average Values
Starting the Homebuying Journey
When a job relocation brought a salary boost to one half of a couple, they decided to explore buying a home in their new state. Though their budget had expanded, unfamiliarity with local neighborhoods and pricing trends posed a challenge. To make informed decisions, they focused on understanding two key metrics: median sale price and average sale price.
Median vs. Average: What’s the Difference?
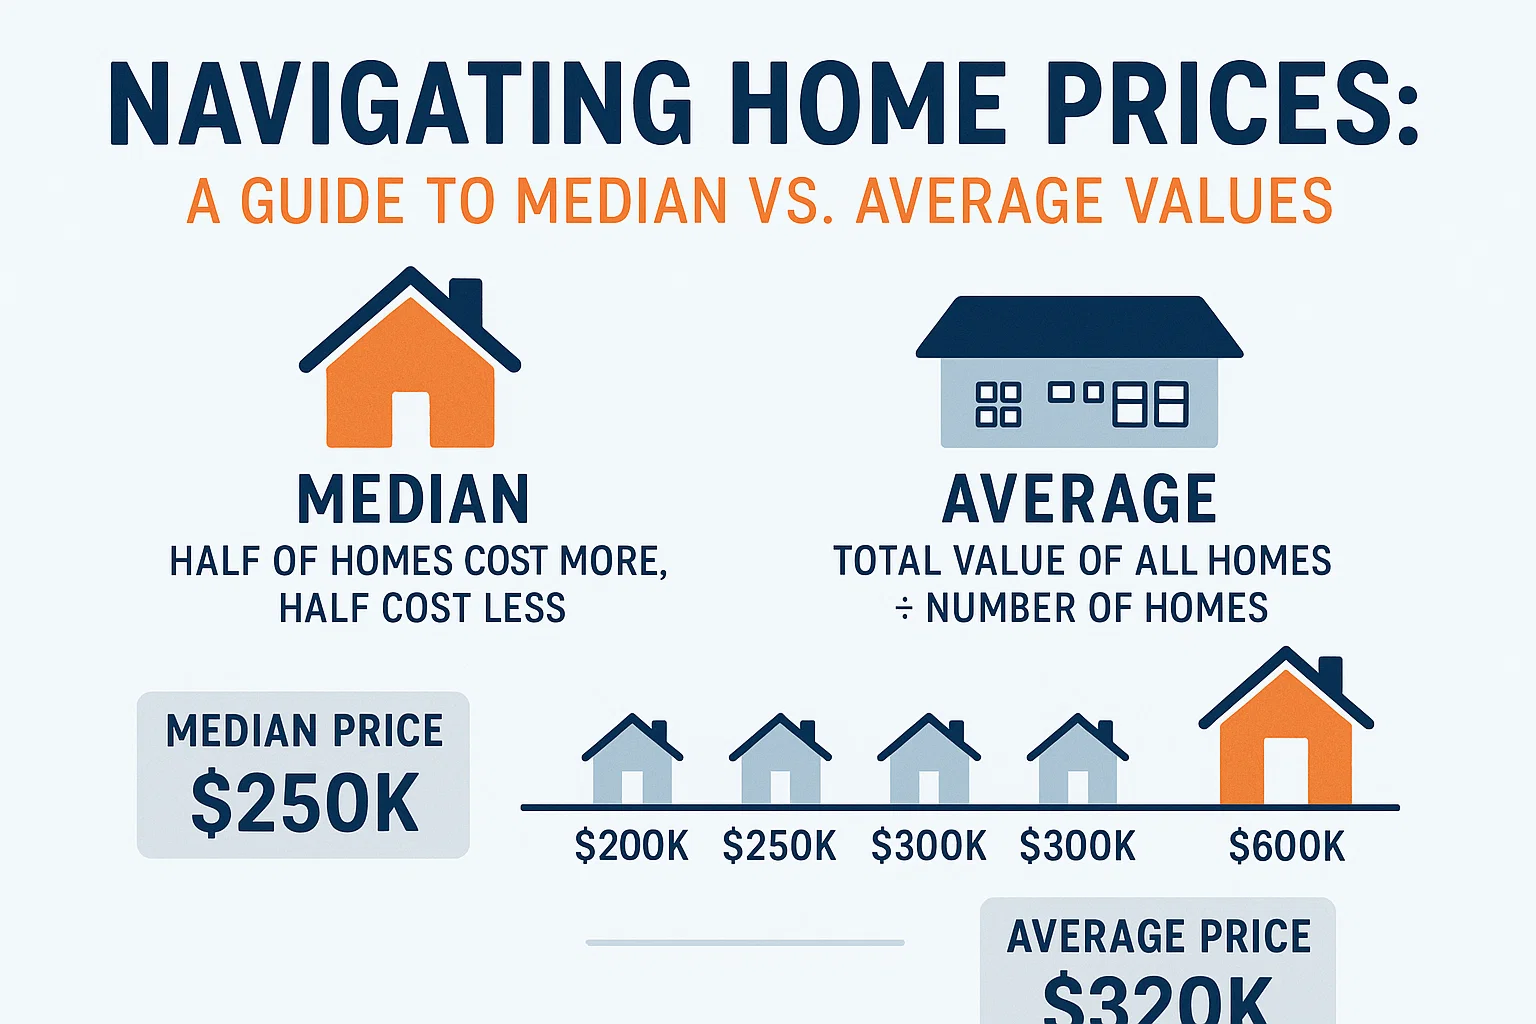
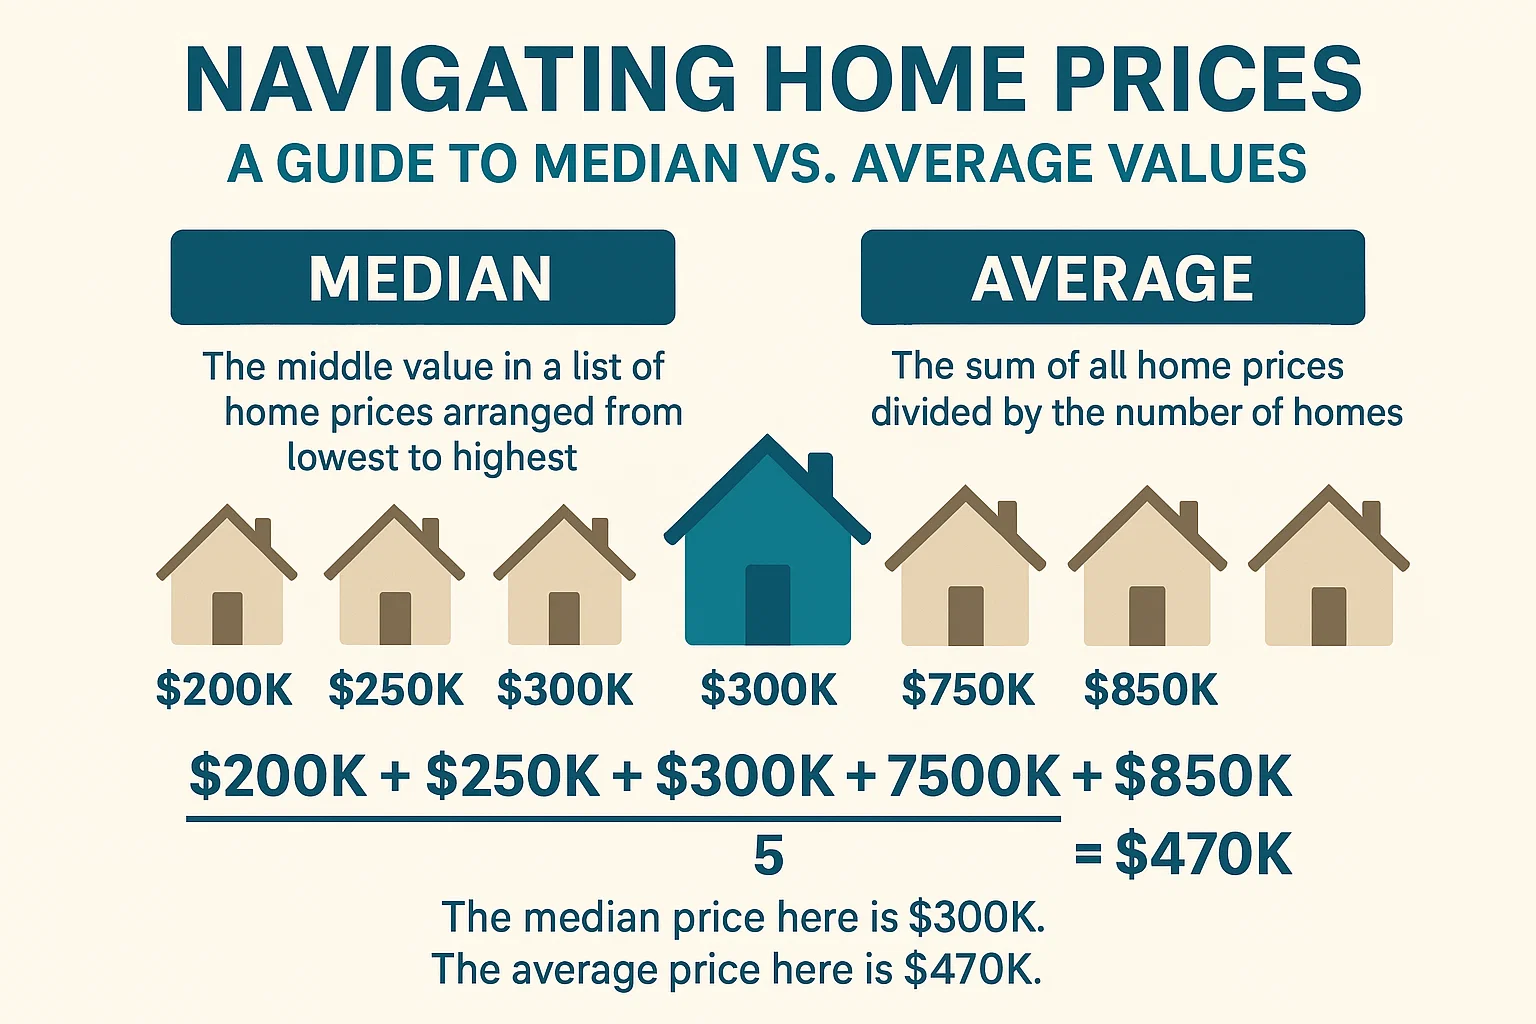
While both metrics provide insight into housing costs, they are calculated differently:
- Average Sale Price: Sum of all home sale prices divided by the number of sales.
- Median Sale Price: Middle value in a sorted list of sale prices, where half sold for more and half for less.
Example 1: Balanced Pricing
Five homes sold in Beaverdale:
- $150,000
- $215,000
- $220,000
- $260,000
- $300,000
Average: $229,000 | Median: $220,000
Here, both metrics align closely, reflecting a balanced market.
Example 2: Skewed Pricing
Five homes sold in University Heights:
- $225,000
- $290,000
- $400,000
- $410,000
- $1,500,000
Average: $565,000 | Median: $400,000
The average is skewed by the $1.5M sale, while the median offers a clearer picture of typical prices.
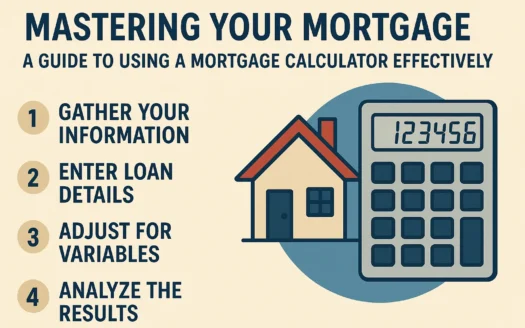
Research Tools for Homebuyers
To evaluate affordability, the couple explored these strategies:
- County-Level Data: Publicly available median price charts helped compare costs across neighboring regions.
- Market Trend Platforms: Online tools provided median home value estimates, historical trends, and market condition analyses.
Key Takeaways
The median price often better reflects a typical home’s cost, especially in areas with high-value outliers. Combining this metric with broader research—such as regional comparisons and market forecasts—empowers buyers to make confident, budget-conscious decisions.